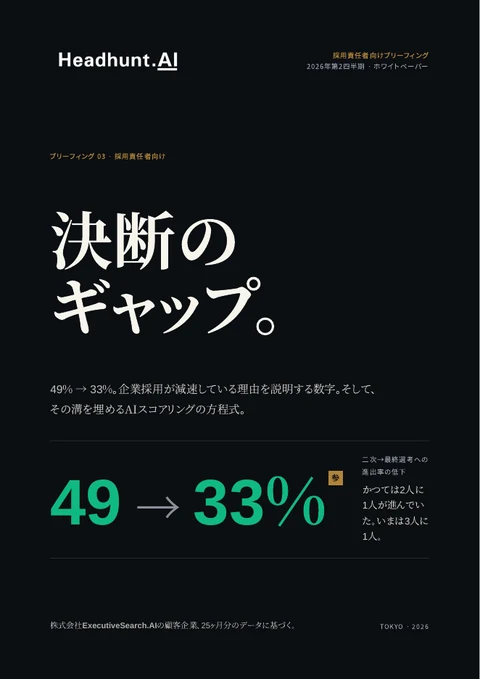
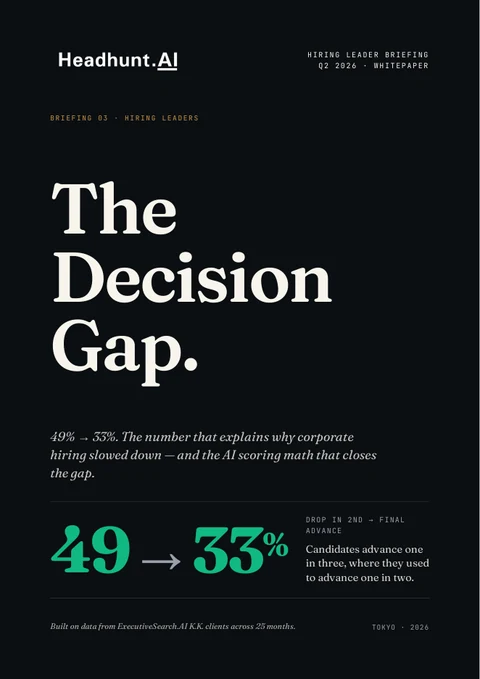
We tracked a representative sample of 3,852 resumes sent, 385 second interviews, and 74 placements across 25 months of corporate hiring data in Japan. One finding stood out: the rate at which companies advance candidates from second interview to final round has dropped by a third. The decline is statistically significant.
That is the headline. Now what it means.
The decision to commit got harder. The decision to hire didn’t.
Companies that do schedule a final round are now closing offers at 58% — up from 40% before mid-2025. The gate is narrower. The close rate on the other side is at record highs. Companies have not lost interest in hiring. The decision to commit a candidate to final-round evaluation is what got dramatically harder to reach.
That is the gap. The rest of this briefing explains where it came from, what it costs you, and how AI-scored shortlists shorten the path back to commitment.
02One stage broke from the rest.
We measure every stage of our clients’ hiring process, from candidate identification through offer accepted. Each stage typically takes about two weeks. Comparing conversion rates before and after July 2025, every stage tightened — but one stage tightened three times more than any other.
| Funnel stage | Before | After | Change |
|---|---|---|---|
| Resume → 1st interview | 29% | 24% | −5 pts |
| 1st → 2nd interview | 38% | 32% | −6 pts |
| 2nd → Final round | 49% | 33% | −16 pts |
| Final round → Offer accepted | 40% | 58% | +18 pts |
Three of the four stages tightened by single-digit points — the kind of marginal selectivity expected in a cautious market. The 2nd-to-Final stage tightened by triple that. And the final stage actually loosened: candidates who survive to final round close at higher rates than they ever have.
This is not "companies are pickier." This is one specific stage breaking from the rest.
0331% fewer hires from the same volume.
A small decline at early stages and a large decline at the commitment stage compound through the funnel. Here is what happens to 100 resumes received, before the shift and after.
| Stage | Before · Apr ’24 → Jun ’25 | After · Jul ’25 → present |
|---|---|---|
| 100 resumes | 100 | 100 |
| After 1st interview | 29 | 24 |
| After 2nd interview | 11 | 8 |
| After final round | 5.4 | 2.5 |
| Offers accepted | 2.1 | 1.5 |
| Net effect | Baseline | −31% fewer hires |
Same starting volume. 31% fewer hires accepted. The leak takes everything below it with it.
This is the math behind the feeling many corporate hiring teams describe: "we’re interviewing more people but filling roles slower." The data confirms it. The funnel is leaking at the commitment point, and the leak takes everything with it.
04The two rates moving in opposite directions.
The 2nd-to-Final rate did not crash overnight. It declined steadily through the second half of 2025, from a peak of 56% in early 2025 to 38% on the most recent rolling 6-month window. A Mann-Kendall non-parametric trend test confirms statistical significance at p = 0.015.
What surprised us most is what happened at the next stage. As the gate to final round got narrower, the close rate on the other side went up. The two lines are moving in opposite directions.
A scissors pattern. The gate to final round is narrower than ever. The close rate on the other side is at record highs. Companies have not stopped wanting to hire — they have moved their commitment threshold up.
The decision gap is not about desire. It is about the organizational process of reaching a commitment.
05Three obvious explanations. None work.
When we present this data to corporate hiring leaders, three explanations come up first. None of them survive the numbers.
"Candidate quality dropped."
Not primarily. Companies are slightly pickier at early stages — the −5 and −6 point declines suggest some general selectivity increase. But these are modest. The 2nd-to-Final drop is three times larger. That is not general pickiness. It is specific hesitation at the commitment point.
"Closing got harder."
The opposite. Final-to-Offer conversion rose from 40% to 58%. When companies commit, they hire at record rates.
"It’s noise."
We applied a Mann-Kendall non-parametric trend test to the rolling conversion data. The decline is significant at p = 0.015. We tested every other stage with the same methodology. Only 2nd-to-Final shows a statistically significant declining trend.
What is left is a specific, narrow finding: the commitment decision — the one that requires budget sign-off, headcount approval, or committee alignment — has gotten harder to reach.
06Why the commitment decision stalls.
The second interview signals genuine interest. A first interview is exploratory. A second meeting says: "we are interested enough to invest more time."
Advancing to a final round says something bigger. It says: "we are ready to make a hiring decision." That is not a screening decision. It is a commitment decision. It typically requires three things — and any one of them can stall the process.
-
Budget sign-off.
Someone above the hiring manager has to confirm the headcount is funded and the salary band is right. In a cautious market, this conversation is harder than it was in 2023.
-
Headcount approval.
The role still has to exist when the candidate gets through. In 2025–2026, more companies are pausing requisitions mid-process than at any time in our 8-year dataset.
-
Committee alignment.
Multiple stakeholders have to agree this candidate is worth the final-round investment. Disagreement at this stage is louder than disagreement earlier — because the stakes are higher.
The bar of evidence required to reach commitment moved up. The bar of evidence in the average candidate file did not. That is the gap. Closing it is an evidence problem, not a desire problem.
07You don’t lower the bar. You raise the evidence.
If the bottleneck is "the evidence is too thin to commit," there are two ways to address it. You can lower the bar. Or you can raise the evidence.
Lowering the bar is not realistic in this market — it runs against what hiring committees are telling each other behind closed doors. Raising the evidence is the only durable lever. That means three things.
-
Stronger initial fit signal.
A candidate file that arrives with explicit, scored evidence of fit on the dimensions that matter — role experience, company tier, tenure pattern, language signal, career trajectory — is qualitatively different from one that arrives with a recruiter’s one-paragraph summary.
-
Higher ceiling on the candidate pool.
The candidate who barely cleared a manual longlist is not the candidate who clears a final-round committee. If the longlist itself is weak, the survivors are weak. Pool quality at the top determines decision quality at the bottom.
-
Defensible reasoning, not just intuition.
"I think this person is great" reaches commitment more slowly than "this candidate scores in the top 2% on these specific dimensions, with this specific evidence." Both reach the same conclusion. One reaches it three weeks faster.
This is the gap Headhunt.AI was built to close.
08The mechanism.
Headhunt.AI is the AI sourcing platform built by ExecutiveSearch.AI K.K. — a Tokyo recruiting firm operating an AI-first model since 2018. We built it for our own desks and have been running on it daily for eight years. We license it to corporate in-house TA teams and we run it as a service through AgentRPO. Either way, the engine is the same.
-
Universe-level scoring across 4M+ Japan-focused profiles.
Headhunt.AI scores the entire reachable Japan candidate universe against your specific role criteria. Not keyword matching. Real fit on role, company tier, tenure pattern, language signal, and career trajectory. Each candidate gets a 0–100 ESAI Score with the written evidence behind it.
-
Evidence with every match.
Each ESAI Score comes with the reasoning: which dimensions the candidate scores high on, which they don’t, what the platform inferred from the profile and why. That is auditable. Hiring managers can see why a candidate is a top match before they ever read the resume. So can the budget approver. So can the committee.
-
Bilingual scout messaging in native business Japanese or English.
Headhunt.AI generates outreach that references each candidate’s actual profile and visible career signals — not template merge fields. Native keigo when needed. Clean business English when needed.
The point is not "more candidates." The point is better-evidenced candidates — the kind that survive 2nd-to-Final committee discussions because the evidence in the file already does most of the convincing.
09Production data, our own desk.
We use Headhunt.AI on our own desks every day. In Q1 2026, our recruiters showed clear, measured lifts at every stage of the funnel — comparing the same recruiters working with Headhunt.AI to their previous quarters on manual sourcing.
Same recruiters. Same market. Same fees. Better tools.
These are not lab numbers. They are production results from real recruiters running real searches. The lift on its own at any single stage is modest — 13–14% improvement at most. Stacked across the funnel, they compound. The funnel doubles in throughput because every stage moves in the same direction at once.
Applied to a corporate funnel where the bottleneck is 2nd-to-Final commitment, the same lift produces survivors at the top that hiring committees can actually commit to.
10Three operating models. One single-role pilot.
Each of the three has the same engine underneath. The difference is who runs it.
Model 01 · Headhunt.AI license — your in-house TA team runs the platform.
Your recruiters log in, paste the JD, and get a ranked shortlist of up to 1000 candidates from the 4M-profile Japan database in 1–2 minutes, with ESAI Scores and written reasoning per candidate. Credit-based pricing. Credits never expire.
Model 02 · AgentRPO — we run it for you.
For roles where you don’t want to run the platform yourselves, our recruiters work the search using Headhunt.AI underneath. Shortlists in days, not months. Below-market contingency rates with volume and bundle discounts. Same engine, different operating model.
Model 03 · The single-role pilot — one role. 20 candidates. 48 hours. No charge.
Send us one open role you’ve been struggling to fill — one where the 2nd-to-Final commitment is what’s stalling. We will run it through Headhunt.AI and deliver a 20-candidate AI-scored shortlist with full evidence and reasoning, within 48 hours, at no charge.
If the candidates on the list are stronger than what your current process is producing — and the evidence is strong enough to reach commitment faster — you have your answer. If not, you have your answer too. No contract, no integration, no commitment beyond the role itself.
11Seven questions worth asking inside your org.
The right starting question is not "should we adopt AI sourcing." It is a set of operational diagnostics. The point is not to count check marks. It is to find which of these you can answer with real numbers and which you can only answer in generalities.
- Do you know your 2nd-to-Final conversion rate by role family, measured rather than estimated?
- For candidates who don’t advance from 2nd to Final, do you have a documented reason from the hiring committee — or only a soft no? Soft-no rates above 30% are an evidence problem, not a candidate problem.
- How long does it take from completed 2nd interview to the decision to schedule a final round? If this number has grown by more than a week since 2024, the commitment process has slowed.
- When a hiring committee disagrees about advancing a candidate, what evidence resolves the disagreement? If the answer is "the recruiter’s gut" or "another interview," the evidence layer is too thin.
- What fraction of your shortlists are sourced from passive candidates not in any active applicant pool? If below 50%, you are competing for the same active candidates as every other employer.
- Have you run a structured AI sourcing test on a real open requisition in the last 12 months — or is your current view based on vendor demos?
- If a peer company announced 2× faster time-to-hire on senior roles tomorrow at the same fee structure, what is your concrete response?
12The honest take.
The Japan corporate hiring market is in a transition that will be obvious in retrospect. The 2nd-to-Final commitment decision has moved up in the average company by enough to compound a 31% reduction in placement throughput from the same starting candidate volume.
The companies that solve the evidence-quality problem at the top of the funnel will compound their hires through this period. The companies that don’t will run the same headcount strategy with materially fewer hires per quarter, and absorb the cost of the difference.
These systems are the worst they will ever be today. The pace of improvement in AI is not linear — invest now to stay ahead of your competition, or fall behind.
This is uncomfortable to read. It is more uncomfortable to act on. Doing nothing is a decision, the same as any other. It just looks more like the present, which makes it feel safer than it is.
13Methodology.
This is the technical backing for the findings above. Included for transparency rather than persuasion.
Dataset
Data covers March 2024 to March 2026 (25 months) across corporate clients in Japan. Published sample for this analysis: 3,852 resumes sent, 1,030 first interviews, 385 second interviews, 165 final interviews, 74 placements. This is a representative slice we share for external scrutiny — the firm’s complete placement record across the full client portfolio is not disclosed. Stage-to-stage progression takes roughly two weeks. For monthly aggregation, we apply a +1 month lag (2nd interviews in month M vs finals in month M+1).
Primary trend test
Mann-Kendall non-parametric test on rolling 6-month 2nd-to-Final conversion rates. Result: z = −2.42, p = 0.015. Chosen because it does not assume normality and is robust to outliers.
Breakpoint analysis
Tested every possible split in the monthly series. Strongest break at July 2025 (before: 52% avg, after: 37% avg, Welch’s t = 1.32, p = 0.20). The breakpoint does not reach p < 0.05 individually, but the overall trend does.
Other stages
All other funnel stages tested with identical methodology. Only 2nd-to-Final shows a significant declining trend. Final-to-Offer shows an improving trend but does not reach significance. Placement distribution is overdispersed (variance/mean = 1.82, well above Poisson expectation of 1.0). Quarterly or longer windows are the minimum reliable forecasting unit.
Caveats
25 months is a modest sample. December 2025 (8 placements) was an unusually strong month. Team capacity changes in late 2025 may partially contribute. The analysis locates the symptom; the AI sourcing thesis above proposes a structural answer to the cause.